跳过内容
- Monthly, annual, and custom cycle income and expenditure balance statistics
- Mouse over the categories on the pie chart will show the data of the current category and the percentage
- Mouse click on the category on the pie chart, the table on the right shows the detailed entries of this category of data
- Date left and right arrow buttons to switch between month and year
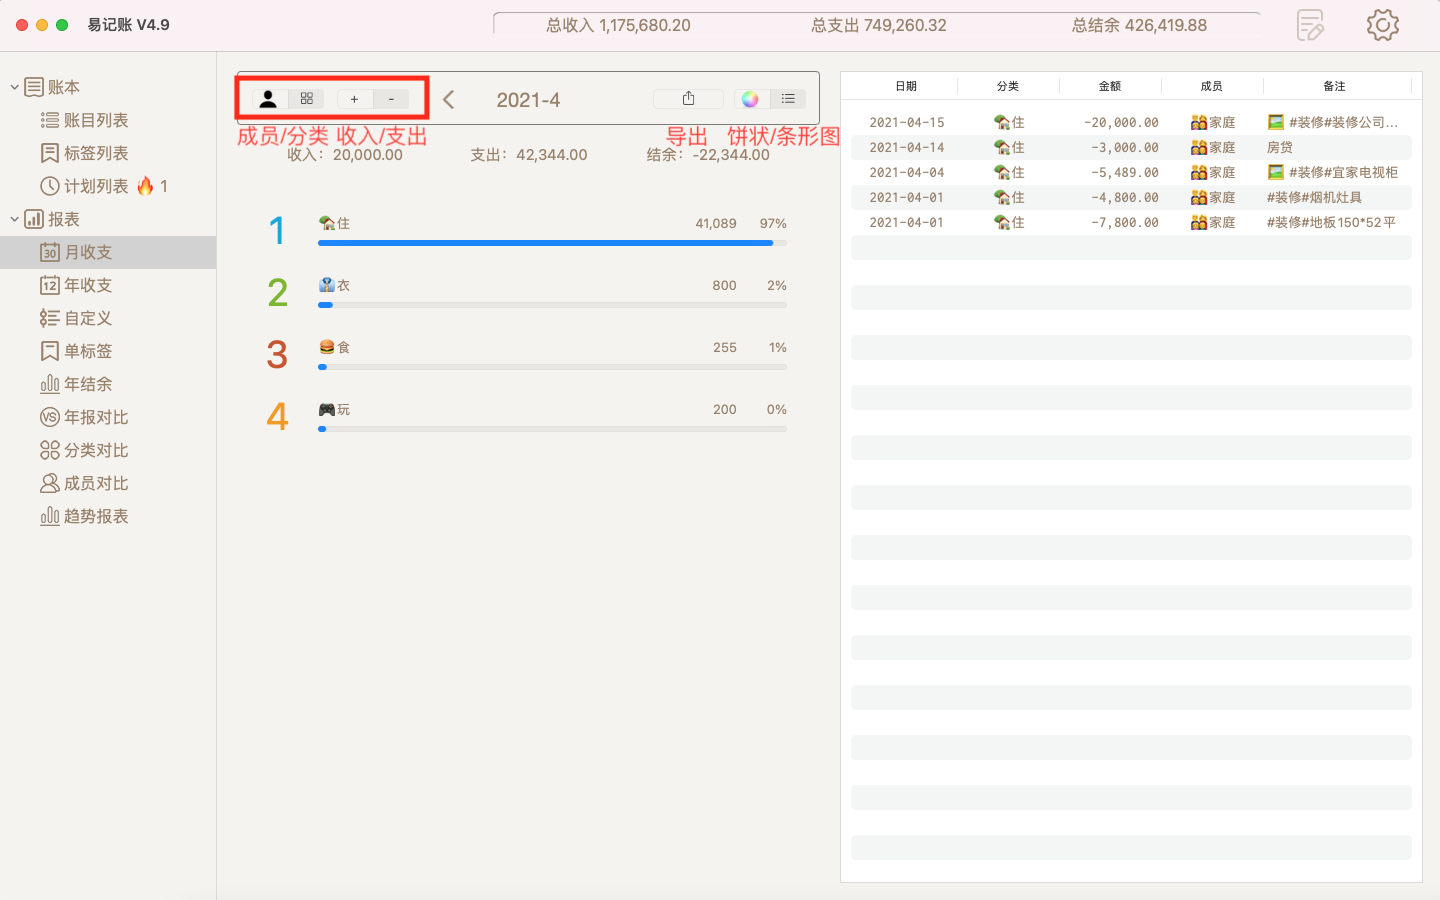
- Member/Category toggle button:View the percentage of each category and view the percentage of each member
- Pie/bar charts can be switched at will
- You can set the start time in the customization, mouse click the date to modify the start time, the default is the latest week of statistics